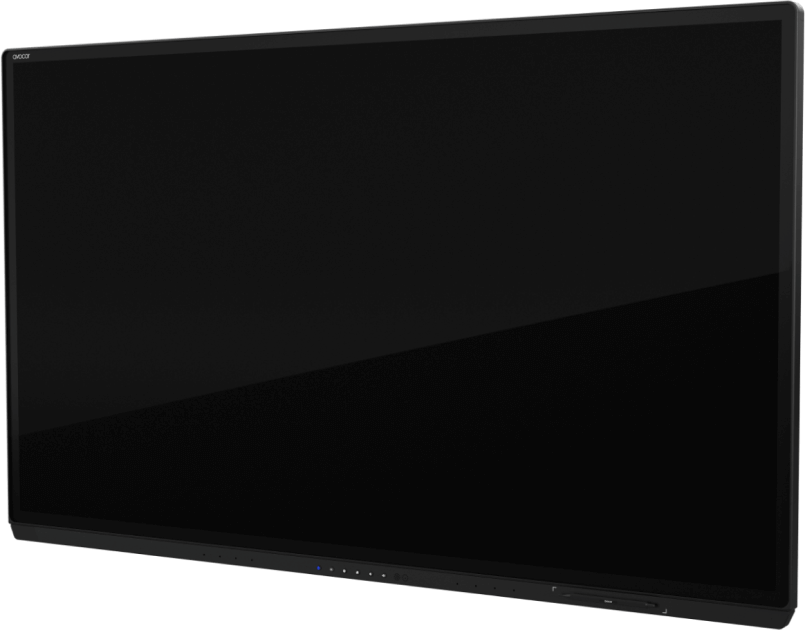
Avocor Aquarius WorkSpace Intelligence leverages data gathered from Avocor W series displays with integrated Azure certified IoT sensors and Microsoft 365 analytics to provide a cost-effective way to collect and turn meeting room data into insights that are vital to space planning and reporting
Avocor Aquarius is a subscription-based service that provides real-time business intelligence of meeting spaces usage, display, and environmental data. Those analytics are delivered in a simple-to-read, real-time dashboard. These powerful analytics then contribute to meeting room well-being and can be leveraged by Enterprise IT and facility management to make essential decisions about current and future space management and to identify real-time cost savings and how to maximize facility and hardware ROI.
Avocor Aquarius subscription-based software is fast and secure to deploy and does not require extensive sensor deployment, custom development, or service contracts.
Avocor Aquarius makes it easy for management and facilities teams to compare and analyze meeting room utilization enabling timely data-driven decisions to support and modify meeting spaces, ensuring maximized space ROI.
Upgrades are delivered Over-The-Air (OTA), meaning your software is always up-to-date and optimal, making the process far more productive for IT teams
Avocor Aquarius had a vast amount of data that can be analyzed, including presence detection, attendee impact on room temperature, humidity, and light conditions.
Show the local time zone selected on the Avocor W series display.
The data table has several features and the data can be sorted by clicking on column headings. The table can be exported by clicking on the three dots at the top right of the data table. By clicking on a row in the table, the chart will be filtered by this data. The data from the Avocor W series displays are grouped into rows as follows:
Shows changes in temperature over time and the number of hours that the W series display(s) were turned on.
Shows the total number of meetings split between those that used and those that did not use the W series display.
Shows the percentage of business hours that the W series display(s) were powered.
Shows the frequency of use of different computer input types e.g. USB-C, HDMI, etc.
Shows the total number of meetings split between those that used and those that did not use the touch capability of the W series display.
Shows the percentage of total time that W series displays were not available / reporting data.
Shows the number of hours that W series display(s) are powered on.
Where a scheduled meeting is interrupted, e.g. an all-day meeting breaks for lunch and everyone leaves the meeting space, when motion is next detected this will be treated as a continuation of the same meeting as it falls within the time covered by the original booking. Although the two parts of the meeting will be shown on the table in two rows (with an empty space row between), this will only be counted as a single meeting. Calculations such as movement in temperature will therefore be based on the temperature at the start of the first part of the meeting and the temperature at the end of the second part.
The number of attendees is determined from responses to meeting invites. The total number of attendees is assumed to be: the meeting organizer + the number who accepted + the number who tentatively accepted + the number who did not respond. As the number of attendees can only be determined from meeting invites this information is limited to scheduled meetings. In future this may change as people counting facilities are added to W series displays.
Shows the total number of scheduled meetings split between those that took place and those that did not thus highlighting meeting spaces that are being booked but not used.
Shows the total number of meetings split between scheduled and unscheduled.
Shows the actual duration of meetings vs the time the meeting space was booked for to highlight inefficient use of meeting spaces.
Shows the total number of hours that meeting spaces were occupied vs business hours.
Shows the number of attendees vs the stated capacity of the meeting space to highlight inefficient use or overcrowding.
Show the number of meetings organized per person (limited to the 10 organizers with the most meetings).
Shows the number of meetings grouped by meeting size (number of attendees).
Shows the number of attendees broken down by their response to the meeting invite – accepted, declined, tentative, no response.
Shows a heatmap identifying the most / least popular times for meetings. The business day is broken down into one hour slots and as well as the colour coded indicator the percentage of each hour that the meeting space was in use is shown.
Shows the average temperature over time for both the meeting space and the outside temperature. Outside temperature is obtained from a third-party weather service based on the location of the campus containing the meeting space.
Shows the average humidity over time.
Shows the average light level over time.
Shows the average CO2 level over time.
Shows the impact of different numbers of meeting attendees had on the temperature in one or more meeting spaces. The movement in temperature during the meeting (first reading to last reading) is averaged for the selected meeting spaces and is drawn against the number of attendees in those meetings.
Shows the impact of different numbers of meeting attendees had on the air quality in one or more meeting spaces. The movement in air quality during the meeting (first reading to last reading) is averaged for the selected meeting spaces and is drawn against the number of attendees in those meetings.
Shows the impact of different numbers of meeting attendees had on the humidity in one or more meeting spaces. The movement in humidity during the meeting (first reading to last reading) is averaged for the selected meeting spaces and is drawn against the number of attendees in those meetings.
Shows changes in temperature over time and the number of hours that the W series display(s) were turned on.
Shows the movement in temperature in one or more meeting spaces during meetings. The movement in temperature is averaged for the selected meeting spaces and is drawn against the number of attendees in those meetings.
Shows the number of alerts and the number of meetings.
Shows a breakdown of alerts (temperature too high/low; humidity too high/low; etc) by severity.
Shows the total number of meetings split between those that used and those that did not use the W series display.
Shows the total number of meetings split between those that used and those that did not use the touch capability of the W series display.
Show the local time zone selected on the Avocor W series display.
Shows changes in temperature over time and the number of hours that the W series display(s) were turned on.
Shows the percentage of business hours that the W series display(s) were powered.
Shows the frequency of use of different computer input types e.g. USB-C, HDMI, etc.
Shows the total number of meetings split between those that used and those that did not use the touch capability of the W series display.
Shows the percentage of total time that W series displays were not available / reporting data.
Shows the number of hours that W series display(s) are powered on.
The data table has several features and the data can be sorted by clicking on column headings. The table can be exported by clicking on the three dots at the top right of the data table. By clicking on a row in the table, the chart will be filtered by this data. The data from the Avocor W series displays are grouped into rows as follows:
Shows the total number of meetings split between scheduled and unscheduled.
Where a scheduled meeting is interrupted, e.g. an all-day meeting breaks for lunch and everyone leaves the meeting space, when motion is next detected this will be treated as a continuation of the same meeting as it falls within the time covered by the original booking. Although the two parts of the meeting will be shown on the table in two rows (with an empty space row between), this will only be counted as a single meeting. Calculations such as movement in temperature will therefore be based on the temperature at the start of the first part of the meeting and the temperature at the end of the second part.
The number of attendees is determined from responses to meeting invites. The total number of attendees is assumed to be: the meeting organizer + the number who accepted + the number who tentatively accepted + the number who did not respond. As the number of attendees can only be determined from meeting invites this information is limited to scheduled meetings. In future this may change as people counting facilities are added to W series displays.
Shows the total number of scheduled meetings split between those that took place and those that did not thus highlighting meeting spaces that are being booked but not used.
Shows the actual duration of meetings vs the time the meeting space was booked for to highlight inefficient use of meeting spaces.
Shows the total number of hours that meeting spaces were occupied vs business hours.
Shows the number of attendees vs the stated capacity of the meeting space to highlight inefficient use or overcrowding.
Show the number of meetings organized per person (limited to the 10 organizers with the most meetings).
Shows the number of meetings grouped by meeting size (number of attendees).
Shows the number of attendees broken down by their response to the meeting invite – accepted, declined, tentative, no response.
Shows a heatmap identifying the most / least popular times for meetings. The business day is broken down into one hour slots and as well as the colour coded indicator the percentage of each hour that the meeting space was in use is shown.
Shows the average temperature over time for both the meeting space and the outside temperature. Outside temperature is obtained from a third-party weather service based on the location of the campus containing the meeting space.
Shows the average light level over time.
Shows the average humidity over time.
Shows the average CO2 level over time.
Shows the impact of different numbers of meeting attendees had on the temperature in one or more meeting spaces. The movement in temperature during the meeting (first reading to last reading) is averaged for the selected meeting spaces and is drawn against the number of attendees in those meetings.
Shows the impact of different numbers of meeting attendees had on the air quality in one or more meeting spaces. The movement in air quality during the meeting (first reading to last reading) is averaged for the selected meeting spaces and is drawn against the number of attendees in those meetings.
Shows the impact of different numbers of meeting attendees had on the humidity in one or more meeting spaces. The movement in humidity during the meeting (first reading to last reading) is averaged for the selected meeting spaces and is drawn against the number of attendees in those meetings.
Shows changes in temperature over time and the number of hours that the W series display(s) were turned on.
Shows the movement in temperature in one or more meeting spaces during meetings. The movement in temperature is averaged for the selected meeting spaces and is drawn against the number of attendees in those meetings.
Shows a breakdown of alerts (temperature too high/low; humidity too high/low; etc) by severity.
Shows the number of alerts and the number of meetings.